Population growth is impacting our planet in many ways. According to Population Media Center, when looking back over the last several centuries, global population trends show continuous expansion, both in terms of volume and rapidity. Population is the key factor in the climate crisis, housing and infrastructure, economic growth of a country, and so on. Therefore, a proper forecast of population growth can guide the society to make better decisions in the future.
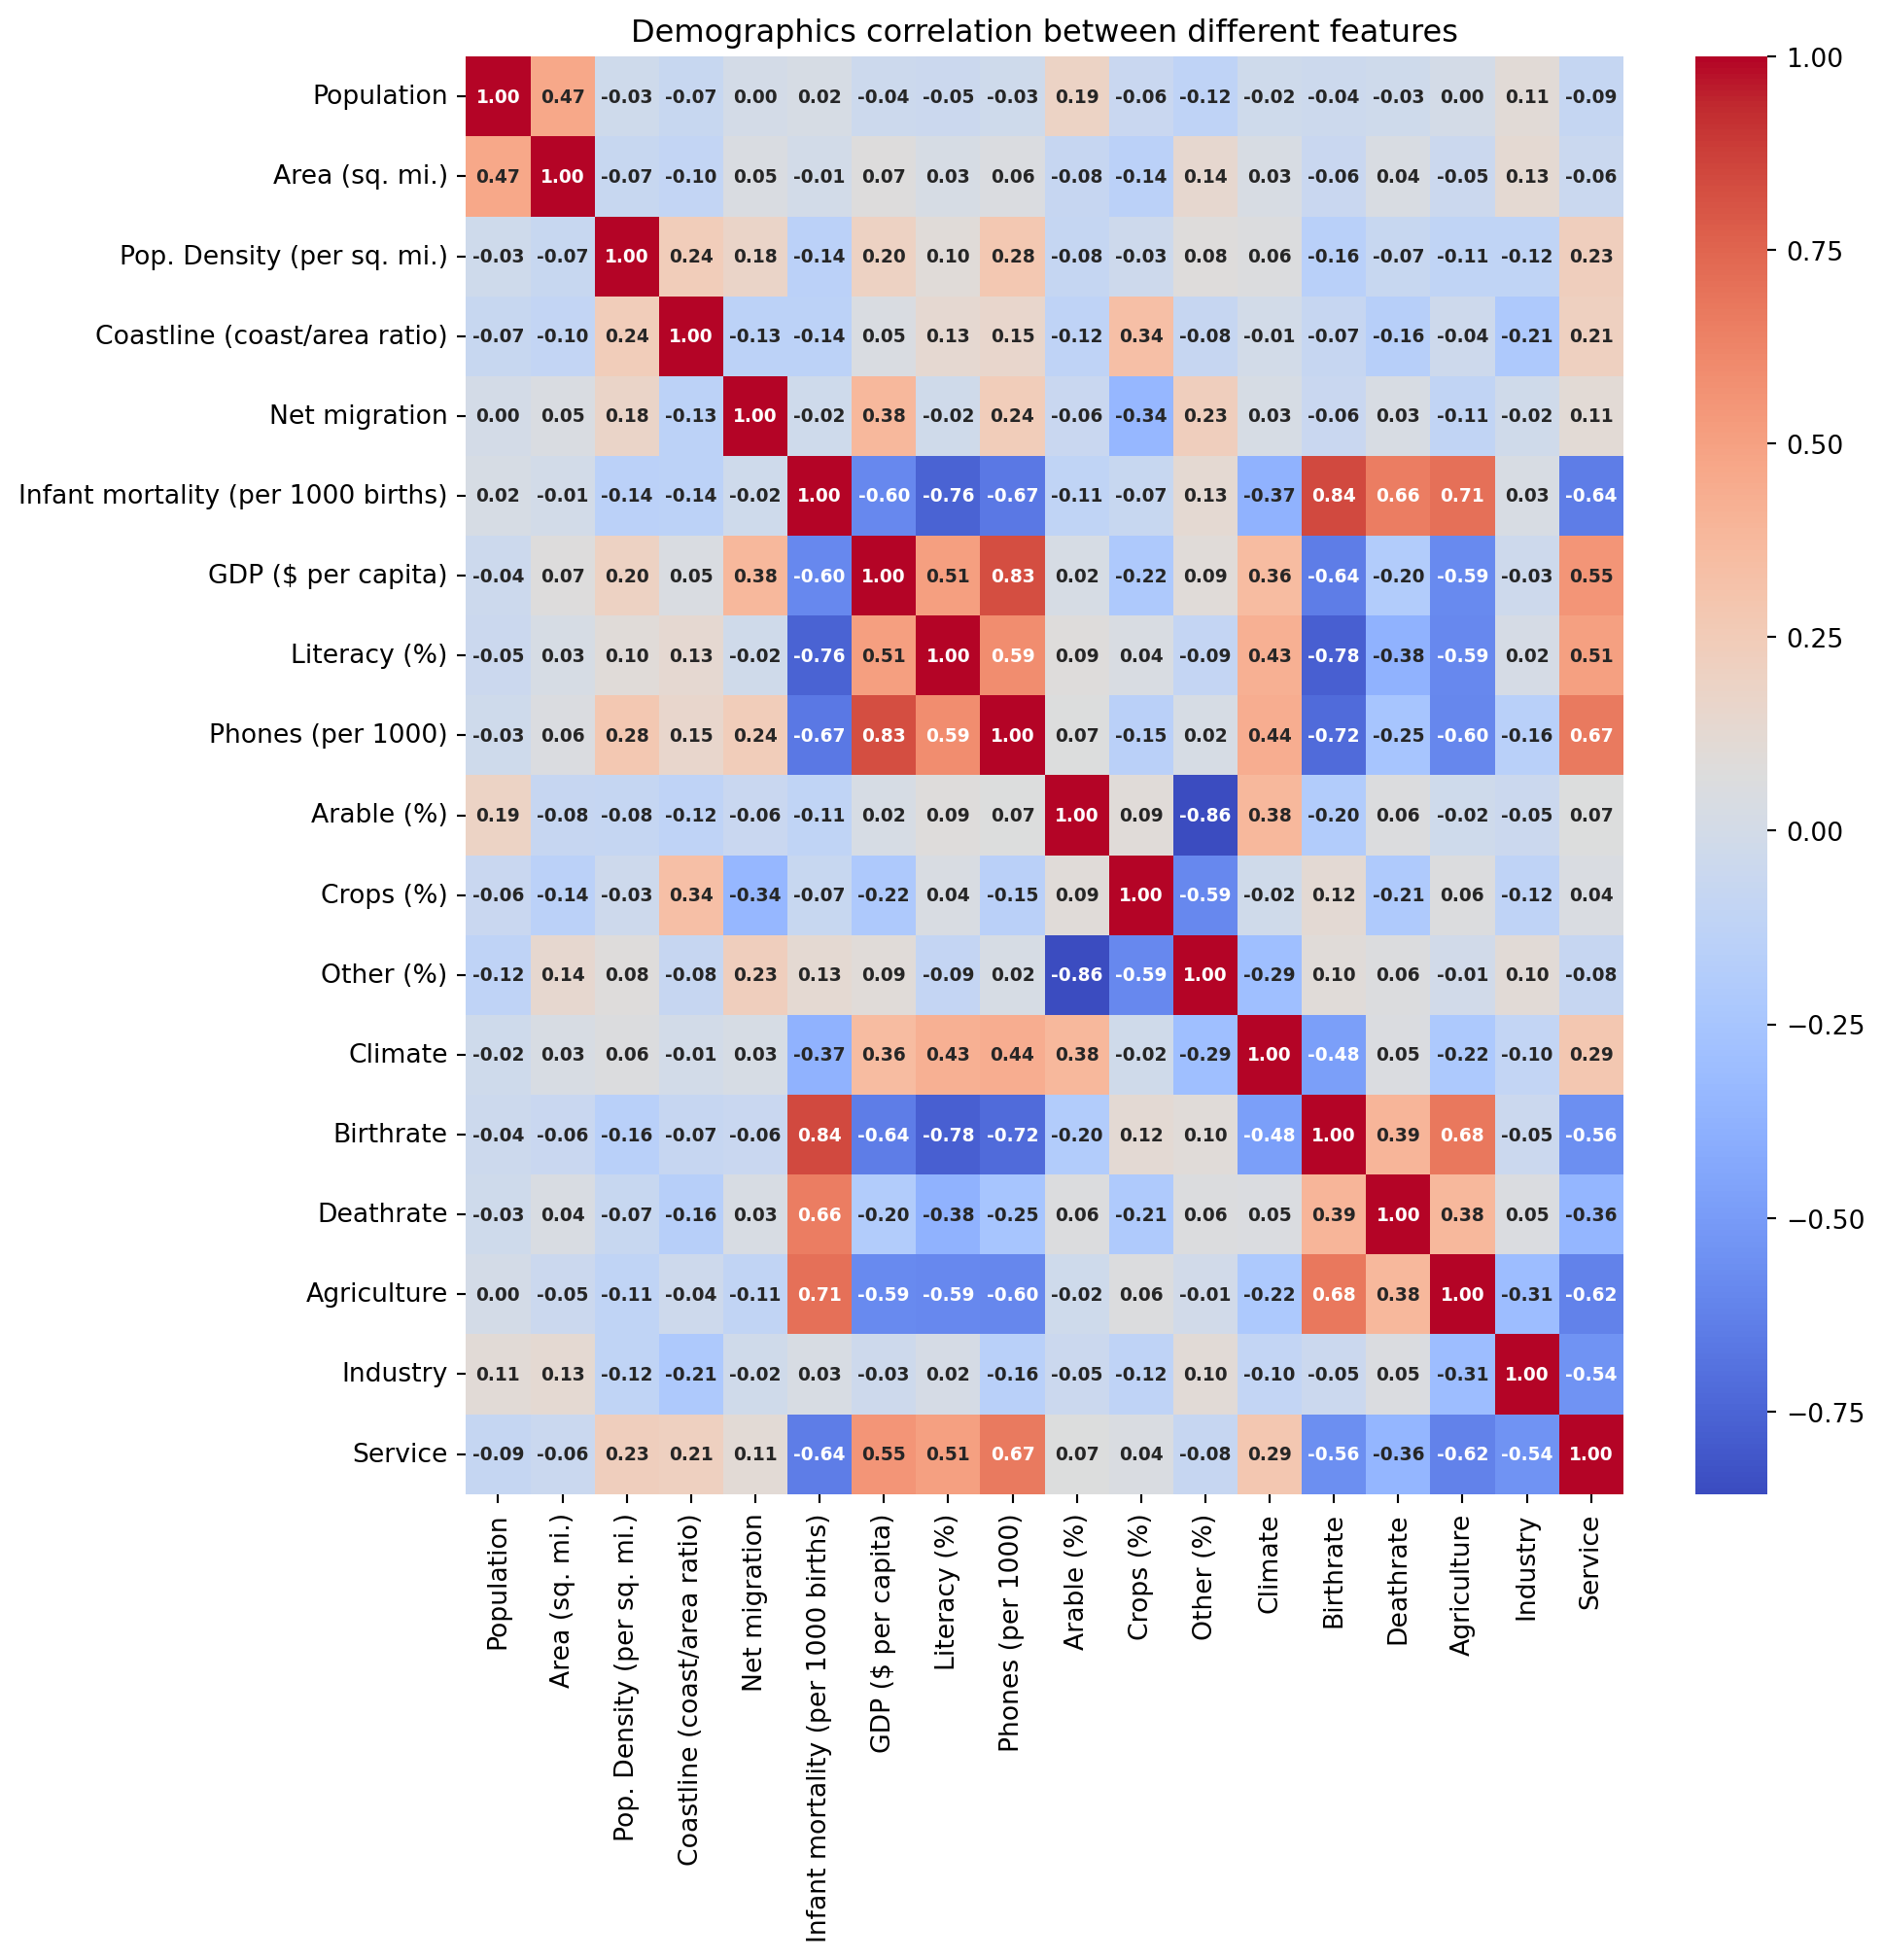
Looking into the data globally, we can get the insight from the expanding of population across the world and it’s correlations. To start with, we will bring the data from the World Bank and analyze the correlation from population to the other demographics features.
Show the code
world_data = pd.read_csv('../data/countries-of-the-world.csv', decimal=',')for col in world_data.columns.values:if world_data[col].isnull().sum() ==0:continueif col =='Climate': guess_values = world_data.groupby('Region')['Climate'].apply(lambda x: x.mode().max())else: guess_values = world_data.groupby('Region')[col].median()for region in world_data['Region'].unique(): world_data[col].loc[(world_data[col].isnull())&(world_data['Region']==region)] = guess_values[region]plt.figure(figsize=(10,10))sns.heatmap(data=world_data.iloc[:,2:].corr(),annot=True,fmt='.2f',cmap='coolwarm', annot_kws={'fontsize': 7,'fontweight': 'bold' })plt.title('Demographics correlation between different features')plt.show()
2 Aging issue in Melbourne
In a global scale, the birthrate and deadrate have negative correlation to the population. Inspired by the fact, we want to look into the aging issue in Melbourne.
Show the code
df_population = pd.read_csv('../data/city-of-melbourne-population-forecasts-by-small-area-2020-2040.csv')df_age = df_population.drop(df_population[df_population['Age'].isin(['Total population', 'Average age'])].index)df_age = df_age.drop(df_age[df_age['Geography'].isin(['City of Melbourne'])].index)fig = px.bar(df_age, x='Year', y='Value', color='Age', barmode='group', title='Total population by Age from 2021 to 2041')fig.show()
The age group from 25-40 is dominating the growth of total population in Melbourne, which shows that Melbourne is a young city. However, the aging issue is still a concern. Defined the elderly age group as 65+, from the data we can see that the population of elderly age group is increasing by the a fast pace.
Show the code
df_elderly = df_population[df_population['Age'].isin(['Age 65-69', 'Age 70-74', 'Age 75-79', 'Age 80-84', 'Age 85+'])]df_elderly = df_elderly.groupby(['Year', 'Age']).sum().reset_index()fig = px.line(df_elderly, x='Year', y='Value', color='Age', title='Population of Elderly from 2021 to 2041')fig.show()
/var/folders/b4/g666m_w53g9121tp3r4qmzth0000gn/T/ipykernel_30834/2492635057.py:3: FutureWarning:

The default value of numeric_only in DataFrameGroupBy.sum is deprecated. In a future version, numeric_only will default to False. Either specify numeric_only or select only columns which should be valid for the function.
As a young and developed city, Melbourne is also facing the aging issue. This is a challenge for the city to provide the service and proper resources such as healthcare, dwellings and social care for the elderly.
By 2041, the most popular area for the elderly remains as Melbourne CBD with its advantages of convenient city infrastructure and facilities. However, despite the city center, North Melbourne, Southbank and Docklands are also popular for the elderly people, with the quiet and peaceful environment.
4 Takeaways
Based on the analysis, we can conclude that the population growth in the next 20 years: - The population of Melbourne is predominantly composed of young individuals, primarily between the ages of 25 and 40, driving the overall population growth. - Melbourne continues to face concerns regarding its aging population, as the number of elderly individuals is increasing at a rapid rate.